SaaS · Personal build
Pulse Analytics Dashboard
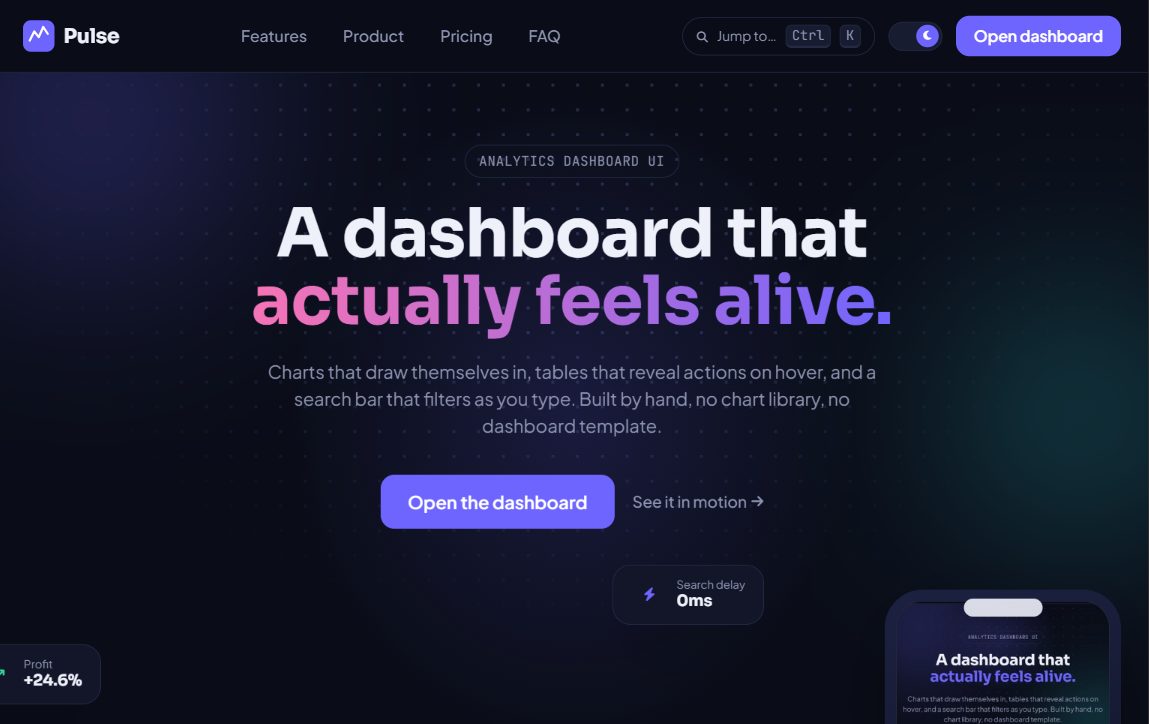
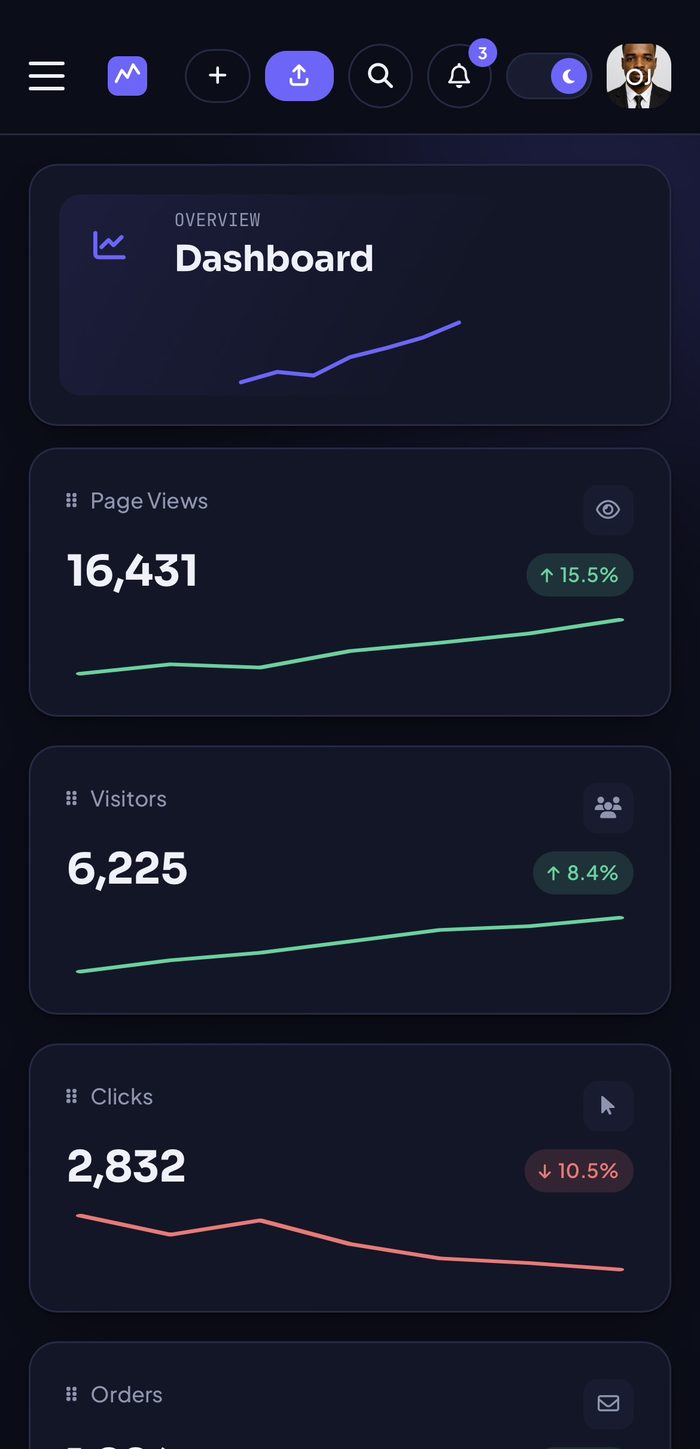
An e-commerce analytics dashboard concept (orders, products, customers, discounts, and reports) built to feel alive rather than static, with custom charts and cursor-responsive interactions.
The challenge
Admin dashboards are usually the least polished part of a product. The goal was to build one that felt as considered and animated as a marketing site, without sacrificing the density and clarity a real analytics tool needs.
The approach
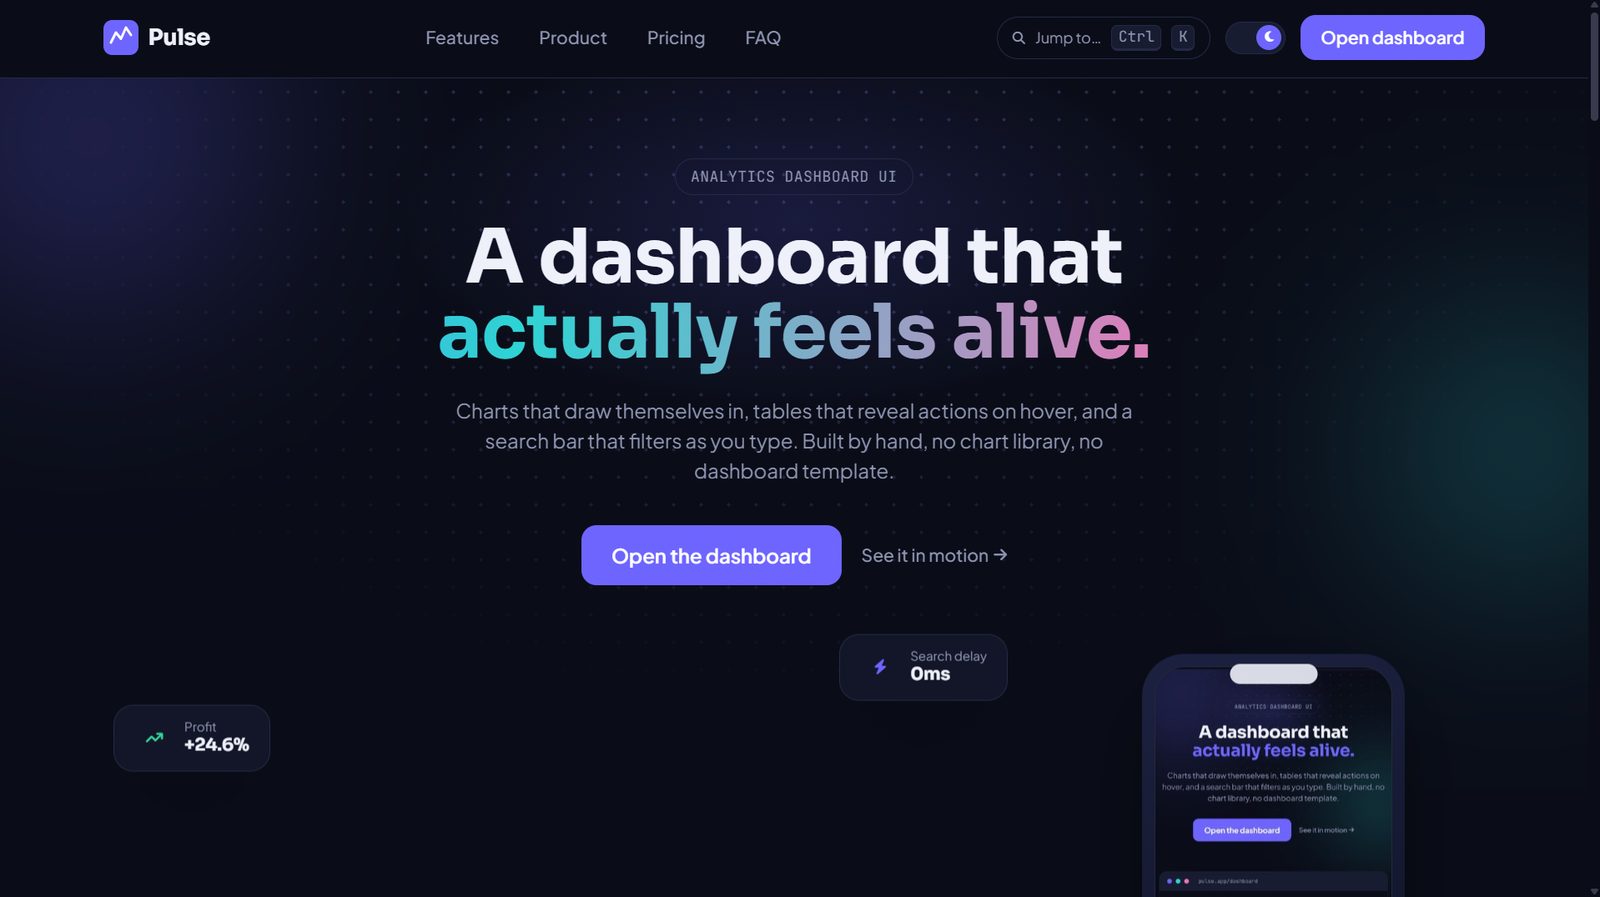
Layered small, deliberate interactions on top of a genuinely functional dashboard: a scroll-scrubbed hero, custom chart tooltips instead of the browser default, magnetic call-to-action buttons, and cascading table rows, all kept subtle enough not to fight each other.
Design
A dark, data-dense interface with custom-styled tooltips and charts rather than default browser styling, plus a page-load progress bar and skeleton loading states so the product feels responsive even while data loads.
Development
Built with HTML, Tailwind CSS, and hand-written JavaScript, including custom chart rendering and tooltip logic rather than relying on a heavy charting library’s default look.
What I solved
- Custom-built chart tooltips replacing native browser tooltips for a cleaner, on-brand data experience.
- A full set of dashboard pages: analytics, orders, products, customers, discounts, content, and reports.
- Scroll-scrubbed and pointer-responsive hero interactions, verified to not conflict with each other.
Result
It's live at justixxprime.github.io/pulse-analytics-dashboard. Most dashboards I'd used before this felt like nobody designed them on purpose. I wanted to see if I could make one that did.
Screens